← All FAA test figures · Aerodynamics
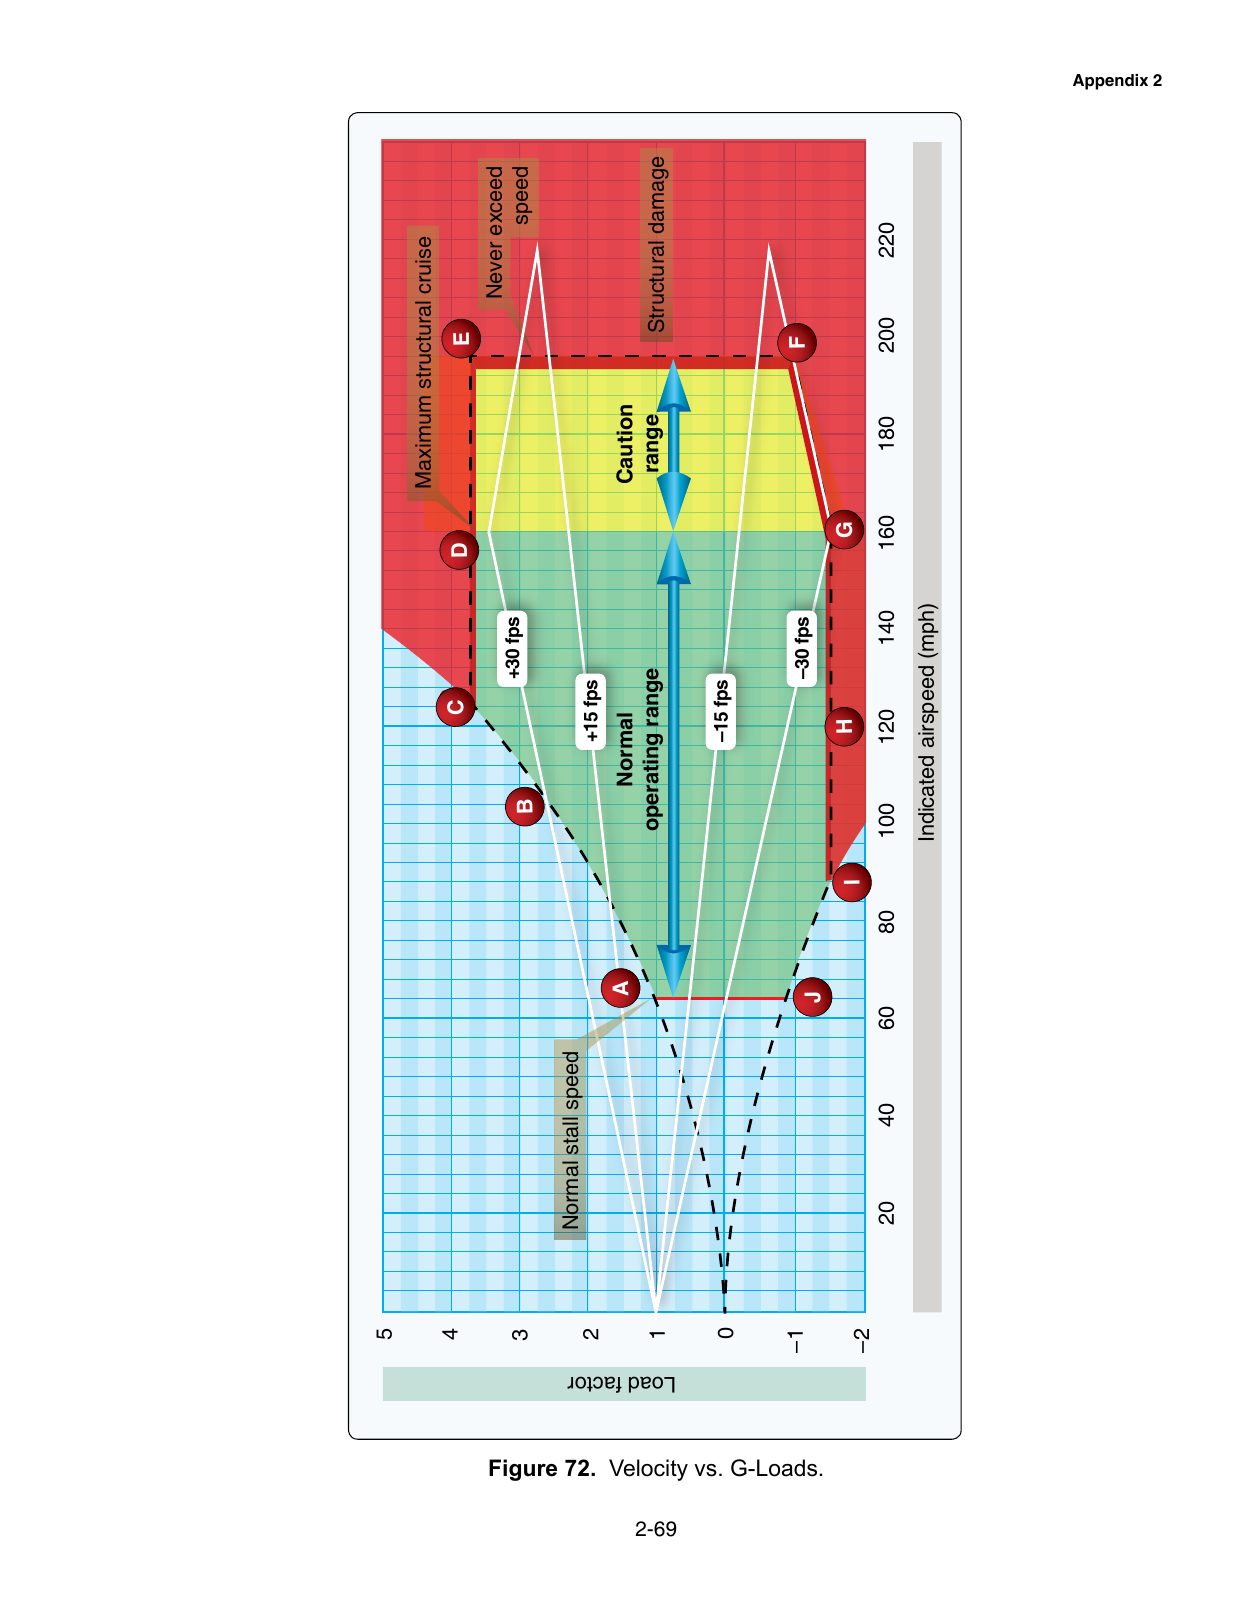
FAA Figure 72: Velocity vs. G-Loads
A velocity-versus-load-factor (Vg) diagram showing maneuvering speed and structural limits.
Source: Airman Knowledge Testing Supplement for Sport Pilot, Recreational Pilot, Remote Pilot, and Private Pilot (FAA-CT-8080-2) — U.S. Government work — public domain (17 U.S.C. §105). Charts are not to scale and not for navigation.