VFR · Lesson 26 · 8 min · ACS PA.I.F
Density Altitude and Aircraft Performance
Reviewed by a panel of three CFIs + AI review
Summary
High, hot, and humid conditions raise density altitude and degrade lift, thrust, and power. Weight, wind, slope, and surface further change takeoff and landing distance.
Also watch
Quick check ▾
One question on what you just read.
Question 1 of 1
Density altitude · Topic mastery: Not started
Exit0 of 1 answered
Density altitude is best defined as which of the following?
Why this matters in flight
Many accidents happen when a pilot expects sea-level performance on a hot, high day. Density altitude quietly steals climb performance and lengthens the runway you need, so you must account for it before takeoff, not discover it on the departure end.
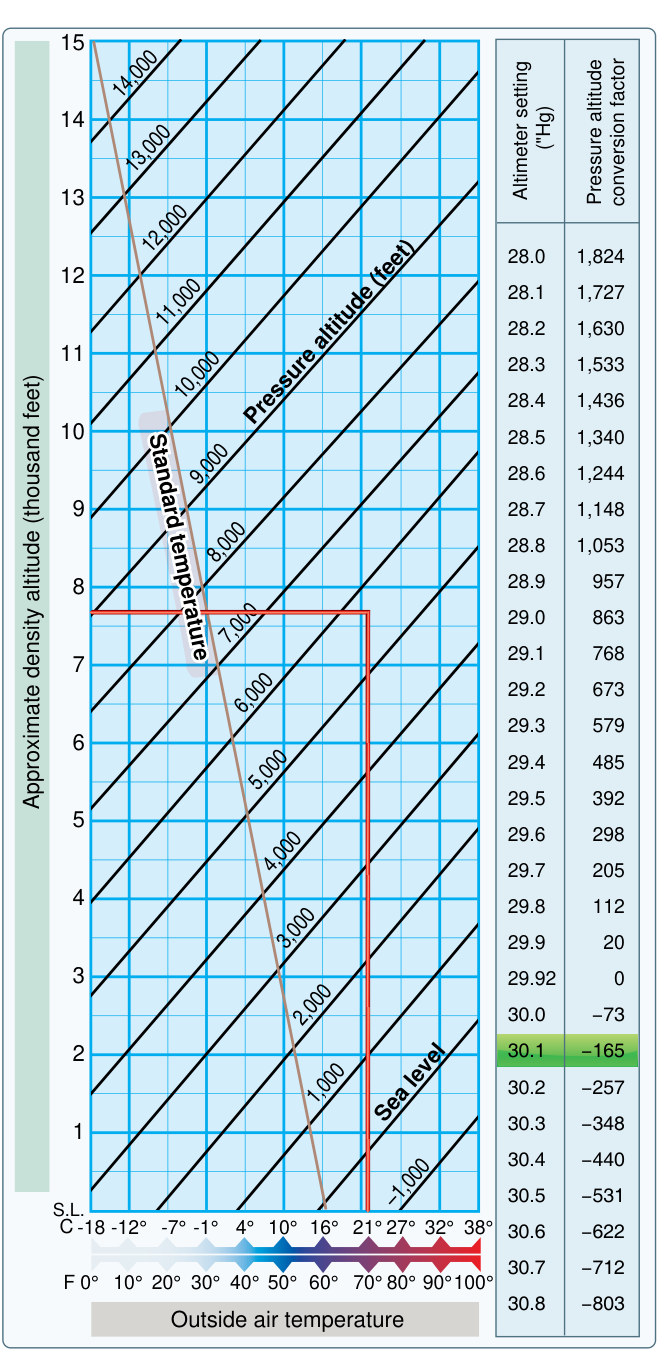
Air density is what the wing, propeller, and engine actually work with, and three factors thin it out: higher altitude, higher temperature, and higher humidity. Density altitude is simply pressure altitude corrected for temperature — the altitude the airplane behaves as if it were flying at. On a hot day at a high-elevation airport, density altitude can be thousands of feet above the field elevation, so the wing makes less lift, the propeller bites less air, and a normally aspirated engine makes less power. That combination lengthens the takeoff roll and flattens the climb. Takeoff and landing distances also grow with higher weight, a tailwind, an upsloping runway on takeoff, and a soft or contaminated surface, while a headwind shortens them. The prudent pilot treats a hot, high, heavy, downwind takeoff as the worst case and plans generous margins. Concepts alone will not pass this ACS area: the exam hands you Testing Supplement figures and expects worked answers. Drill computing density altitude from pressure altitude and temperature on the chart, reading takeoff and landing distances with headwind and tailwind corrections, interpolating between table rows when your weight or temperature falls between them, and pulling fuel flow, range, and endurance (and manifold-pressure settings, where equipped) from cruise-performance tables. Every one of these is a figure read plus arithmetic — practice them as such in the figure track and the practice bank.
Key terms
- Density altitude
- Pressure altitude corrected for nonstandard temperature.
- Pressure altitude
- Altitude read with the altimeter set to 29.92 inHg.
- High, hot, humid
- The three conditions that raise density altitude and cut performance.
Sources & references · 3 · 3 linked
Every claim traces to a source — paraphrased knowledge elements pointing at the governing FAA publication. Items marked verified have been checked against the retrieved source text; the rest are pending verification. Where the exact page or regulation has been located in a retrieved document, the source links straight to it.
- FAA-H-8083-25 (performance) — Pilot’s Handbook of Aeronautical Knowledge verifiedPilot’s Handbook (document)
- FAA-H-8083-25 (performance) — Pilot’s Handbook of Aeronautical Knowledge verifiedPilot’s Handbook (document)
- FAA-H-8083-3 (takeoff/landing) — Airplane Flying Handbook verifiedFAA-H-8083-3C (p. 248)
Community
Ask for more detail or suggest additions to make this lesson better. Community input — not authoritative and not CFI-reviewed.
Sign in or create a free account to join the conversation.
No comments yet — be the first to help improve this lesson.